Transparency
Measured in metres using a Secchi disk this gave annual average, lowest (summer) and highest (winter) readings reflecting the normal variations during the year due to organic growth. As shown in figure l.1 directly below, the results were 6.9, 3.6 and 10.4 metres respectively, which were a little lower than the preceding year but broadly in line with averages over the recent past. Figure l.3 illustrates these seasonal fluctuations for both big and small parts of the lake during the past 17 years and compared with the standard French 5-level scale for classifying the ecological state of the water (Very good, Good, Average, Mediocre and Poor). This shows that there have been a handful of summers where for a few weeks the transparency has dropped into the “Average” level, but rarely into the "Mediocre" and never the "Poor". However for the majority of years the results have only been “Good” and for the vast majority of weeks in all years the results are well into the “Very Good” category. This is the basis for the claim that Lake Annecy is one of clearest lakes in France.
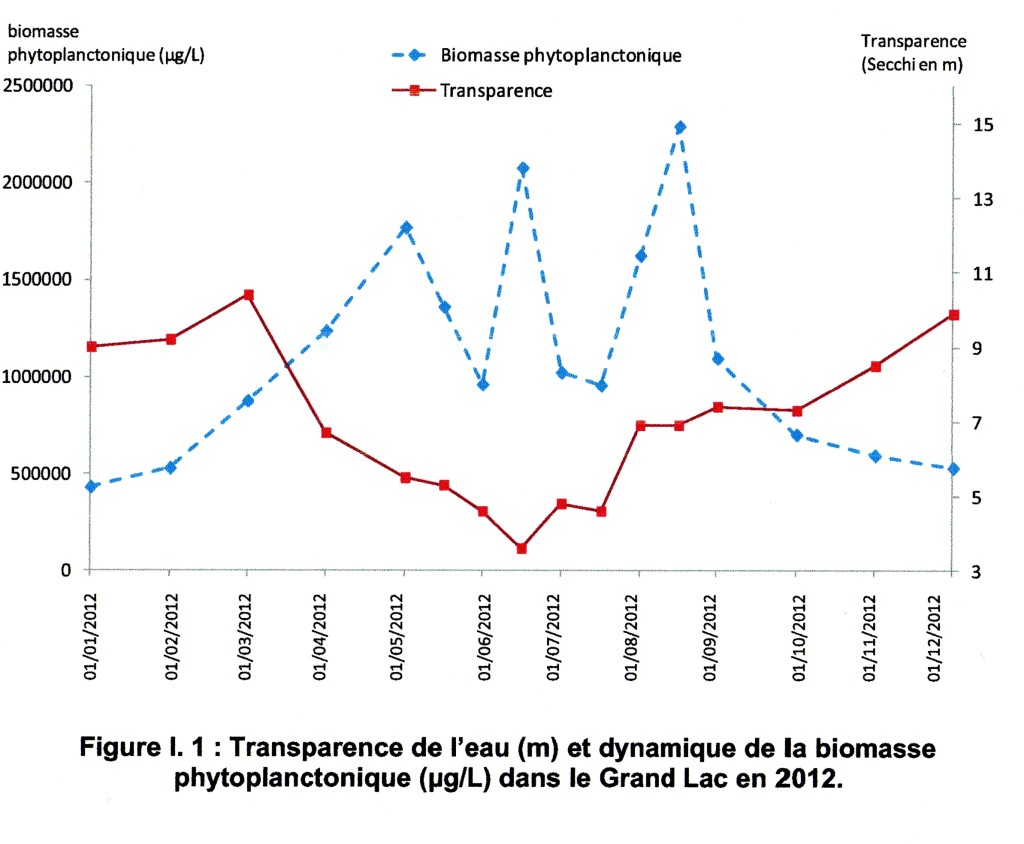
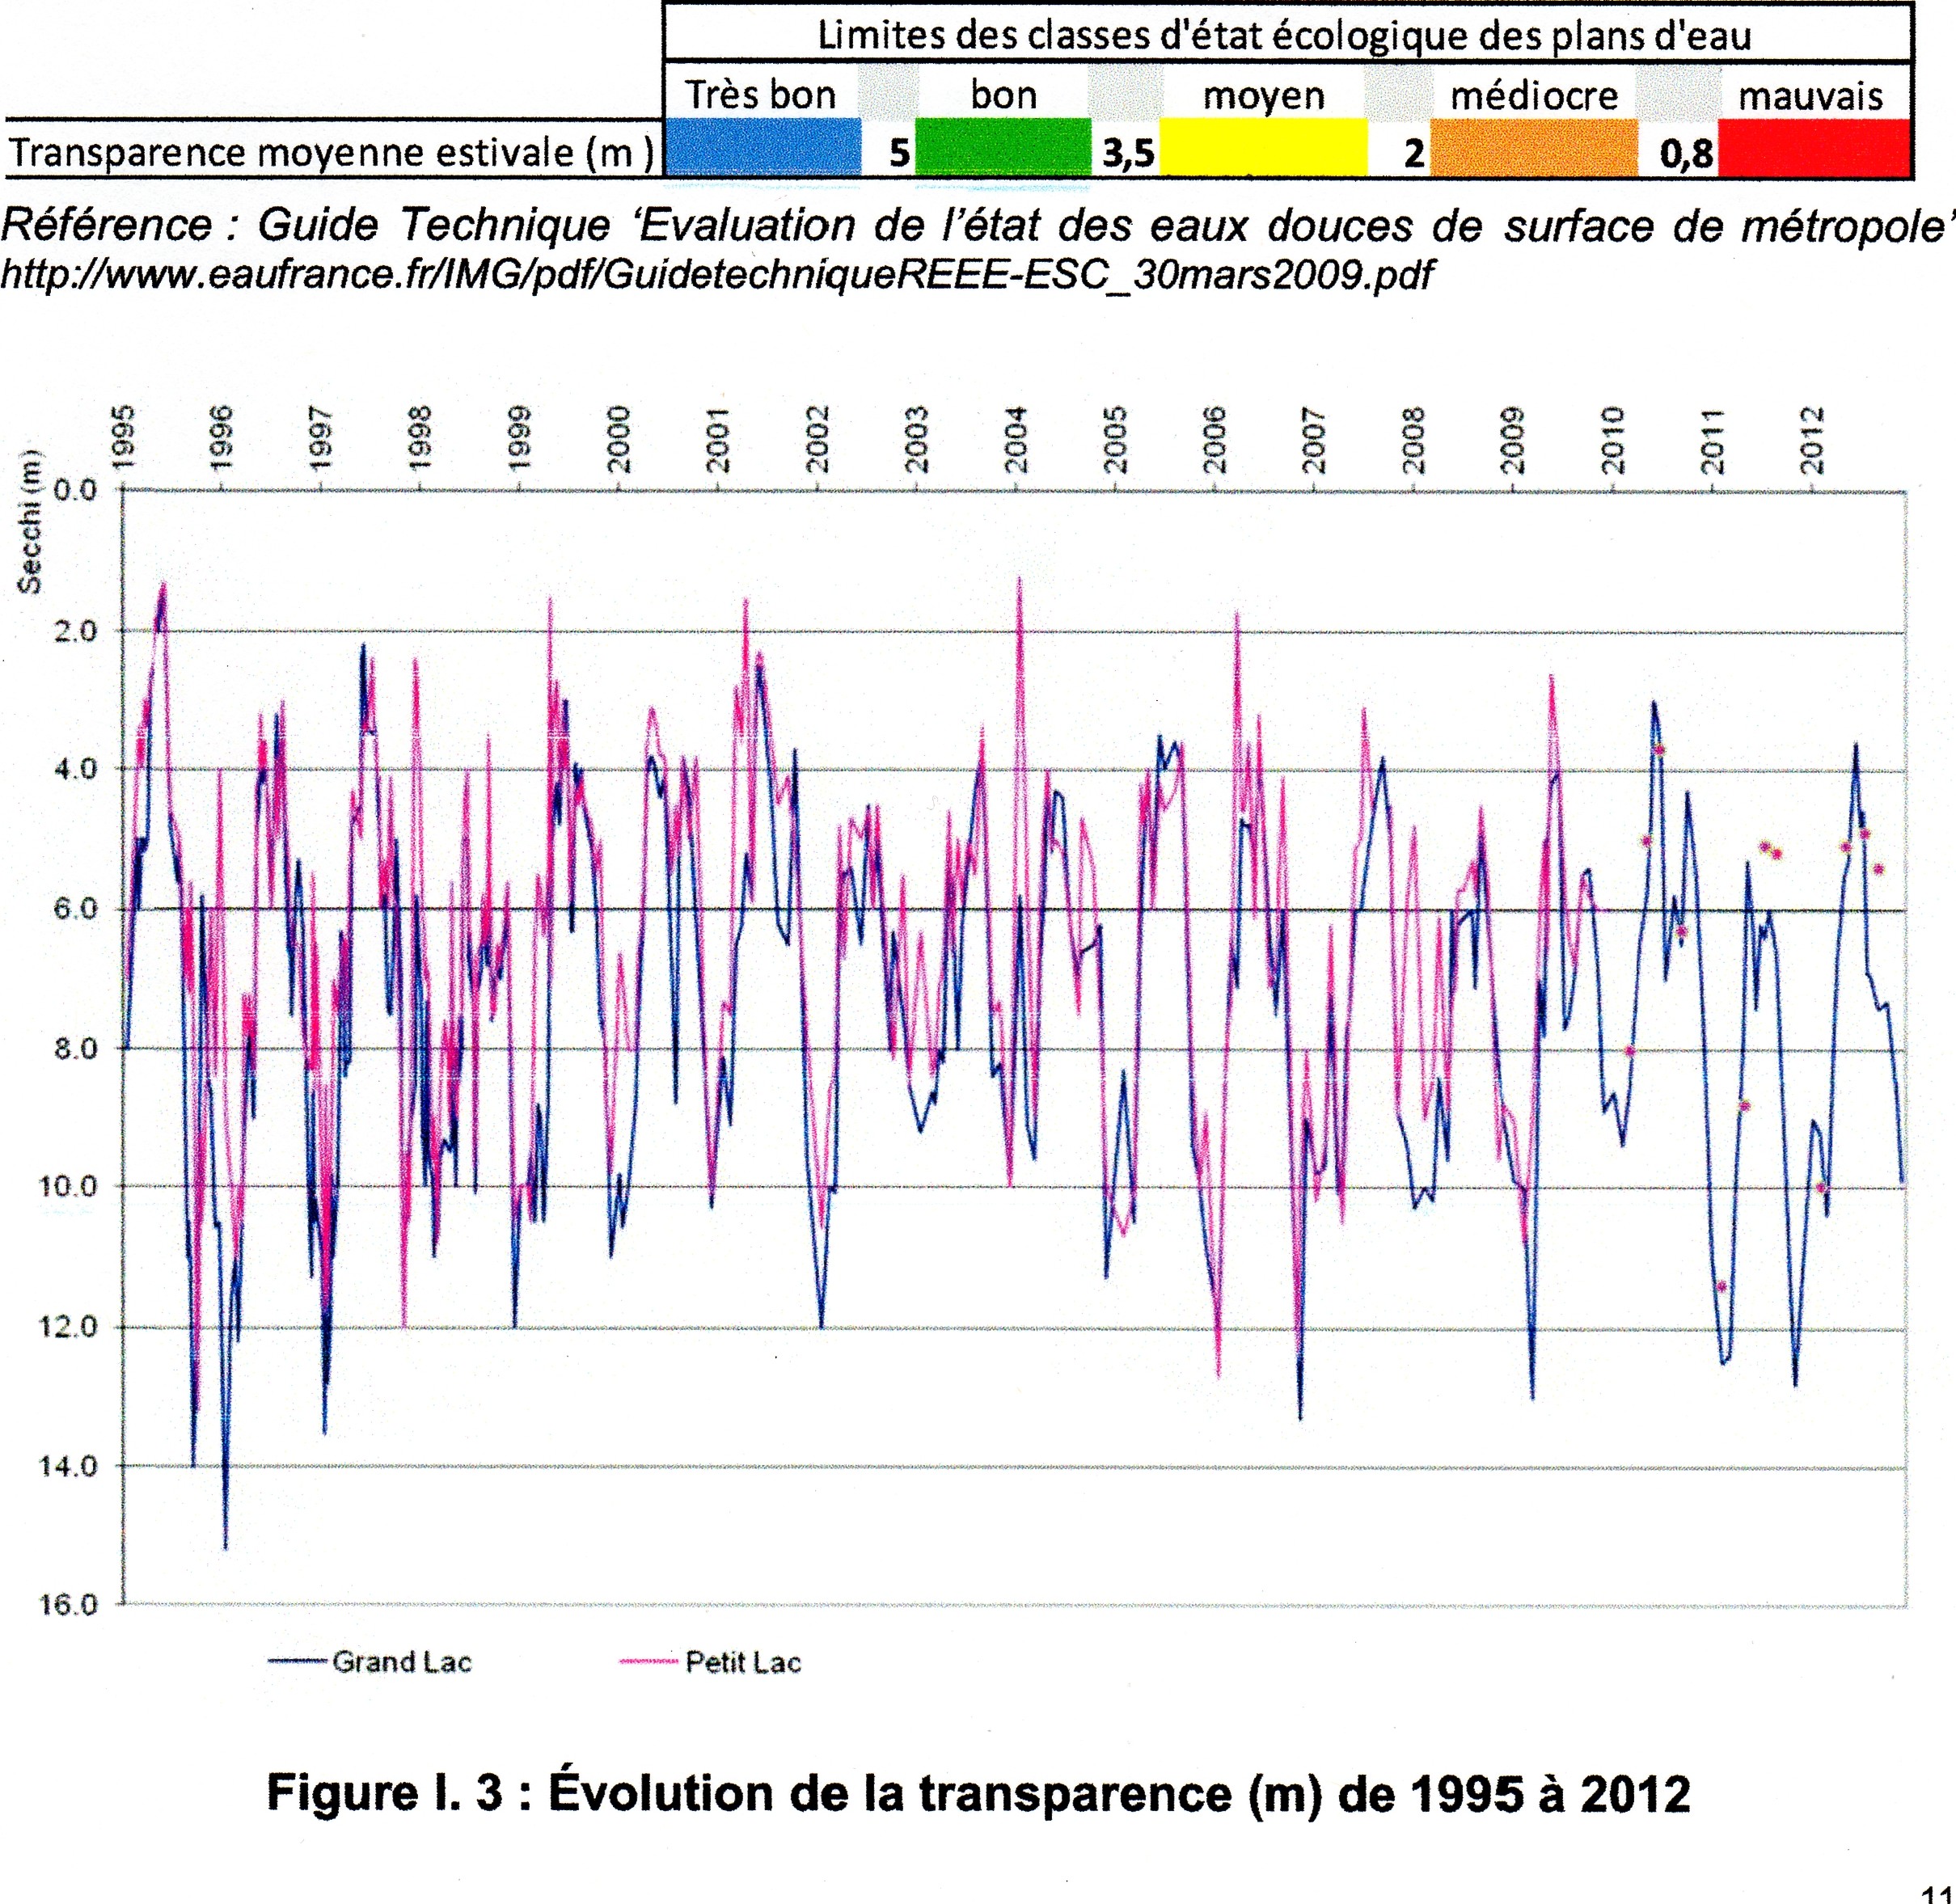
Figure l.3 shows the fluctuating levels of transparency month by month during the past 17 years. The higher the graph the deeper the Cecchi reading, meaning the more transparent the water. The fluctuations during the year are caused by the seasonal changes in the phytoplankton population, which grows rapidly in the spring and summer and declines steeply during winter months.
Dissolved oxygen
Turbidity
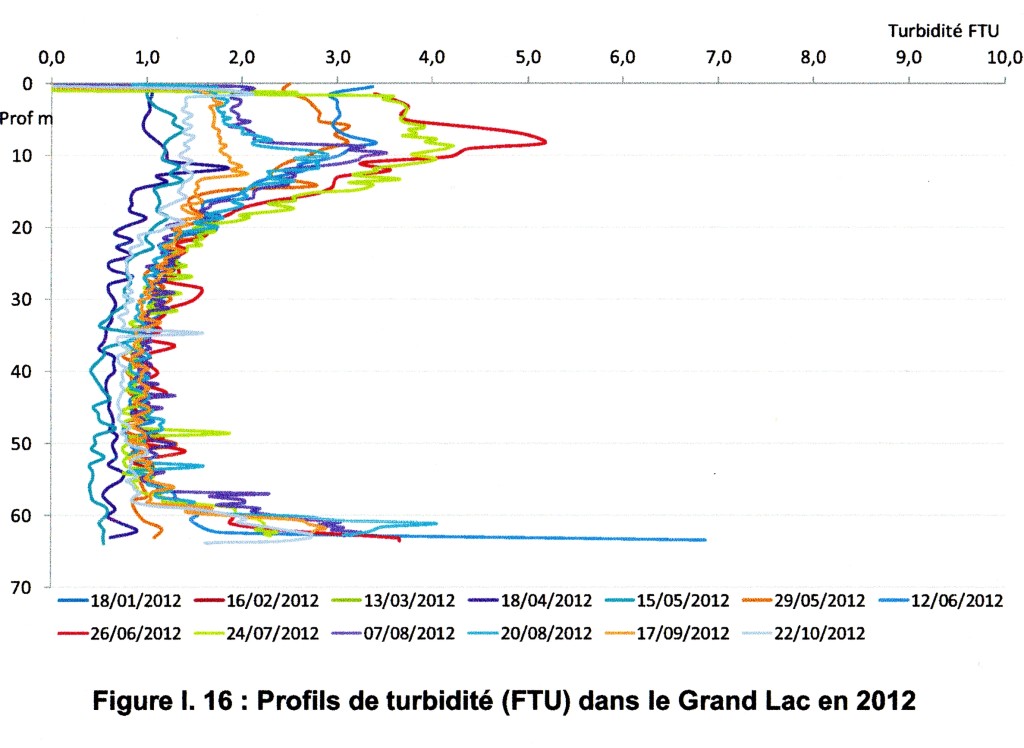
This is another measure of the transparency of the water – why do we need another one? This is because transparency is a vertical measure indicating the clarity of the water looking from top down. Turbidity is a measure taken horizontally at different depths through the lake and give an insight into the level of phytoplanktonic growth at different levels in the lake, not just at the surface. In this case it was found that maximum turbidity occurred on June 26 at a depth of 8 metres, and this was consistent with prior years.
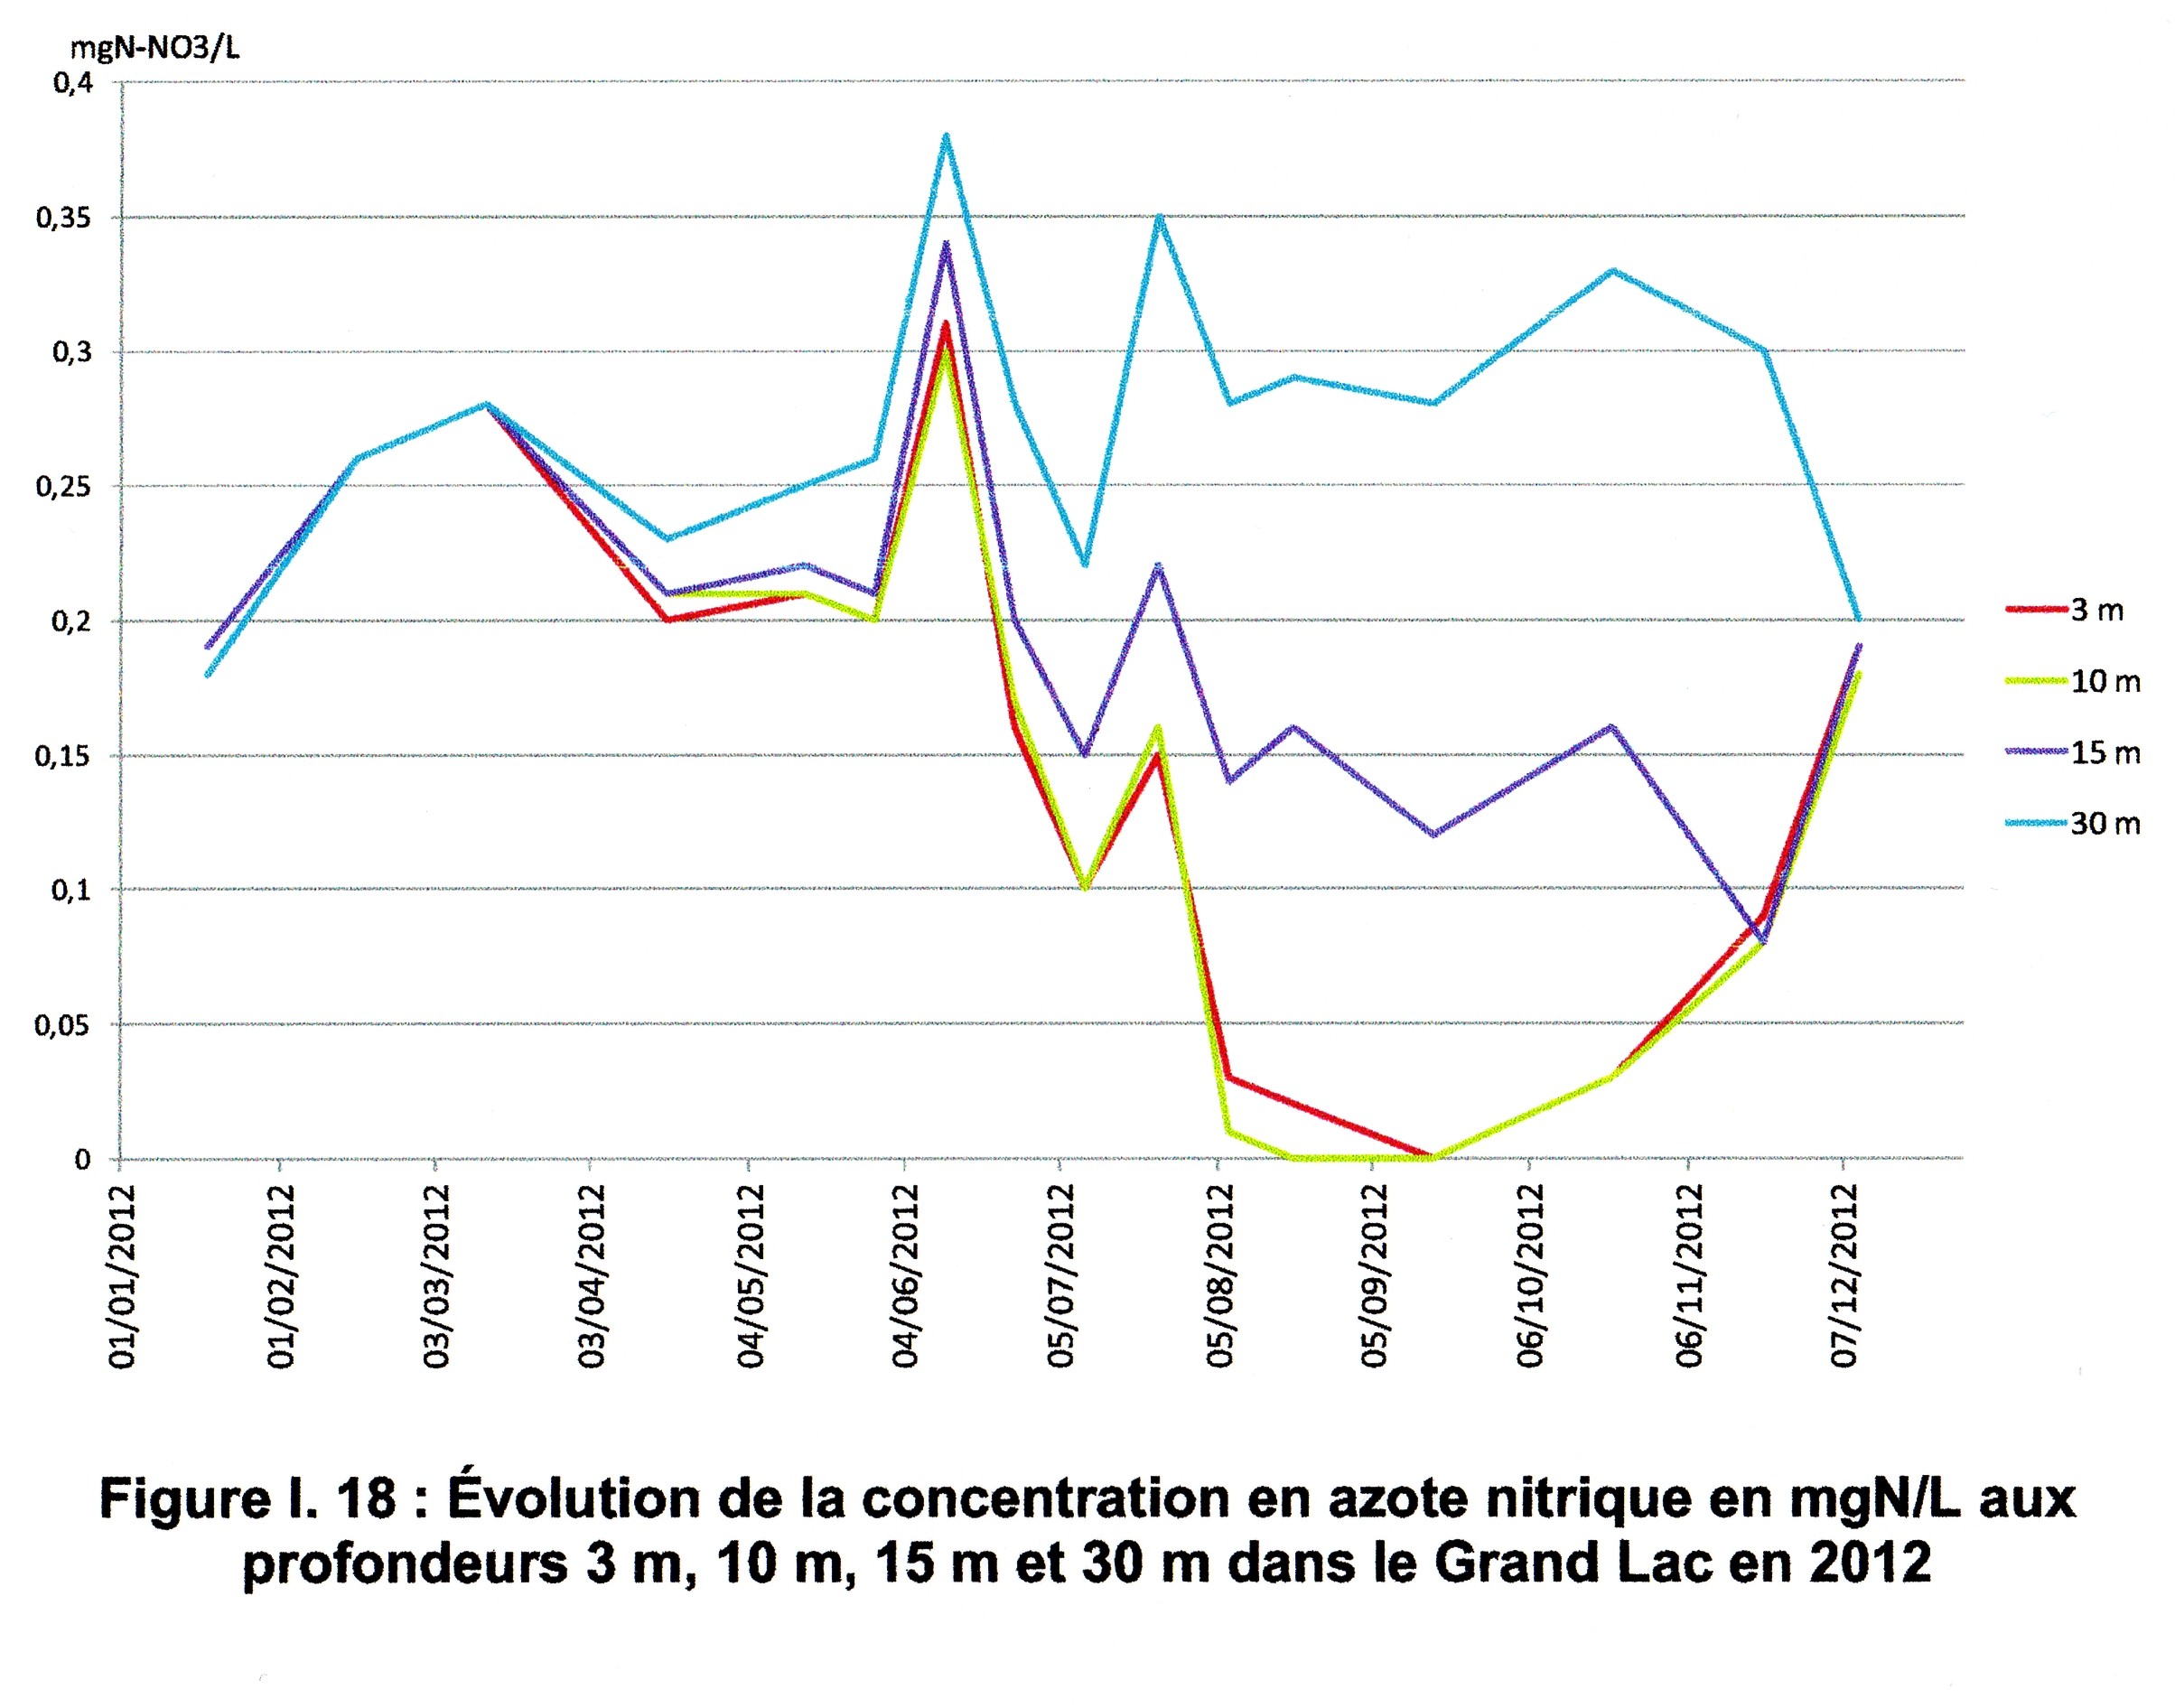
Nitrogen
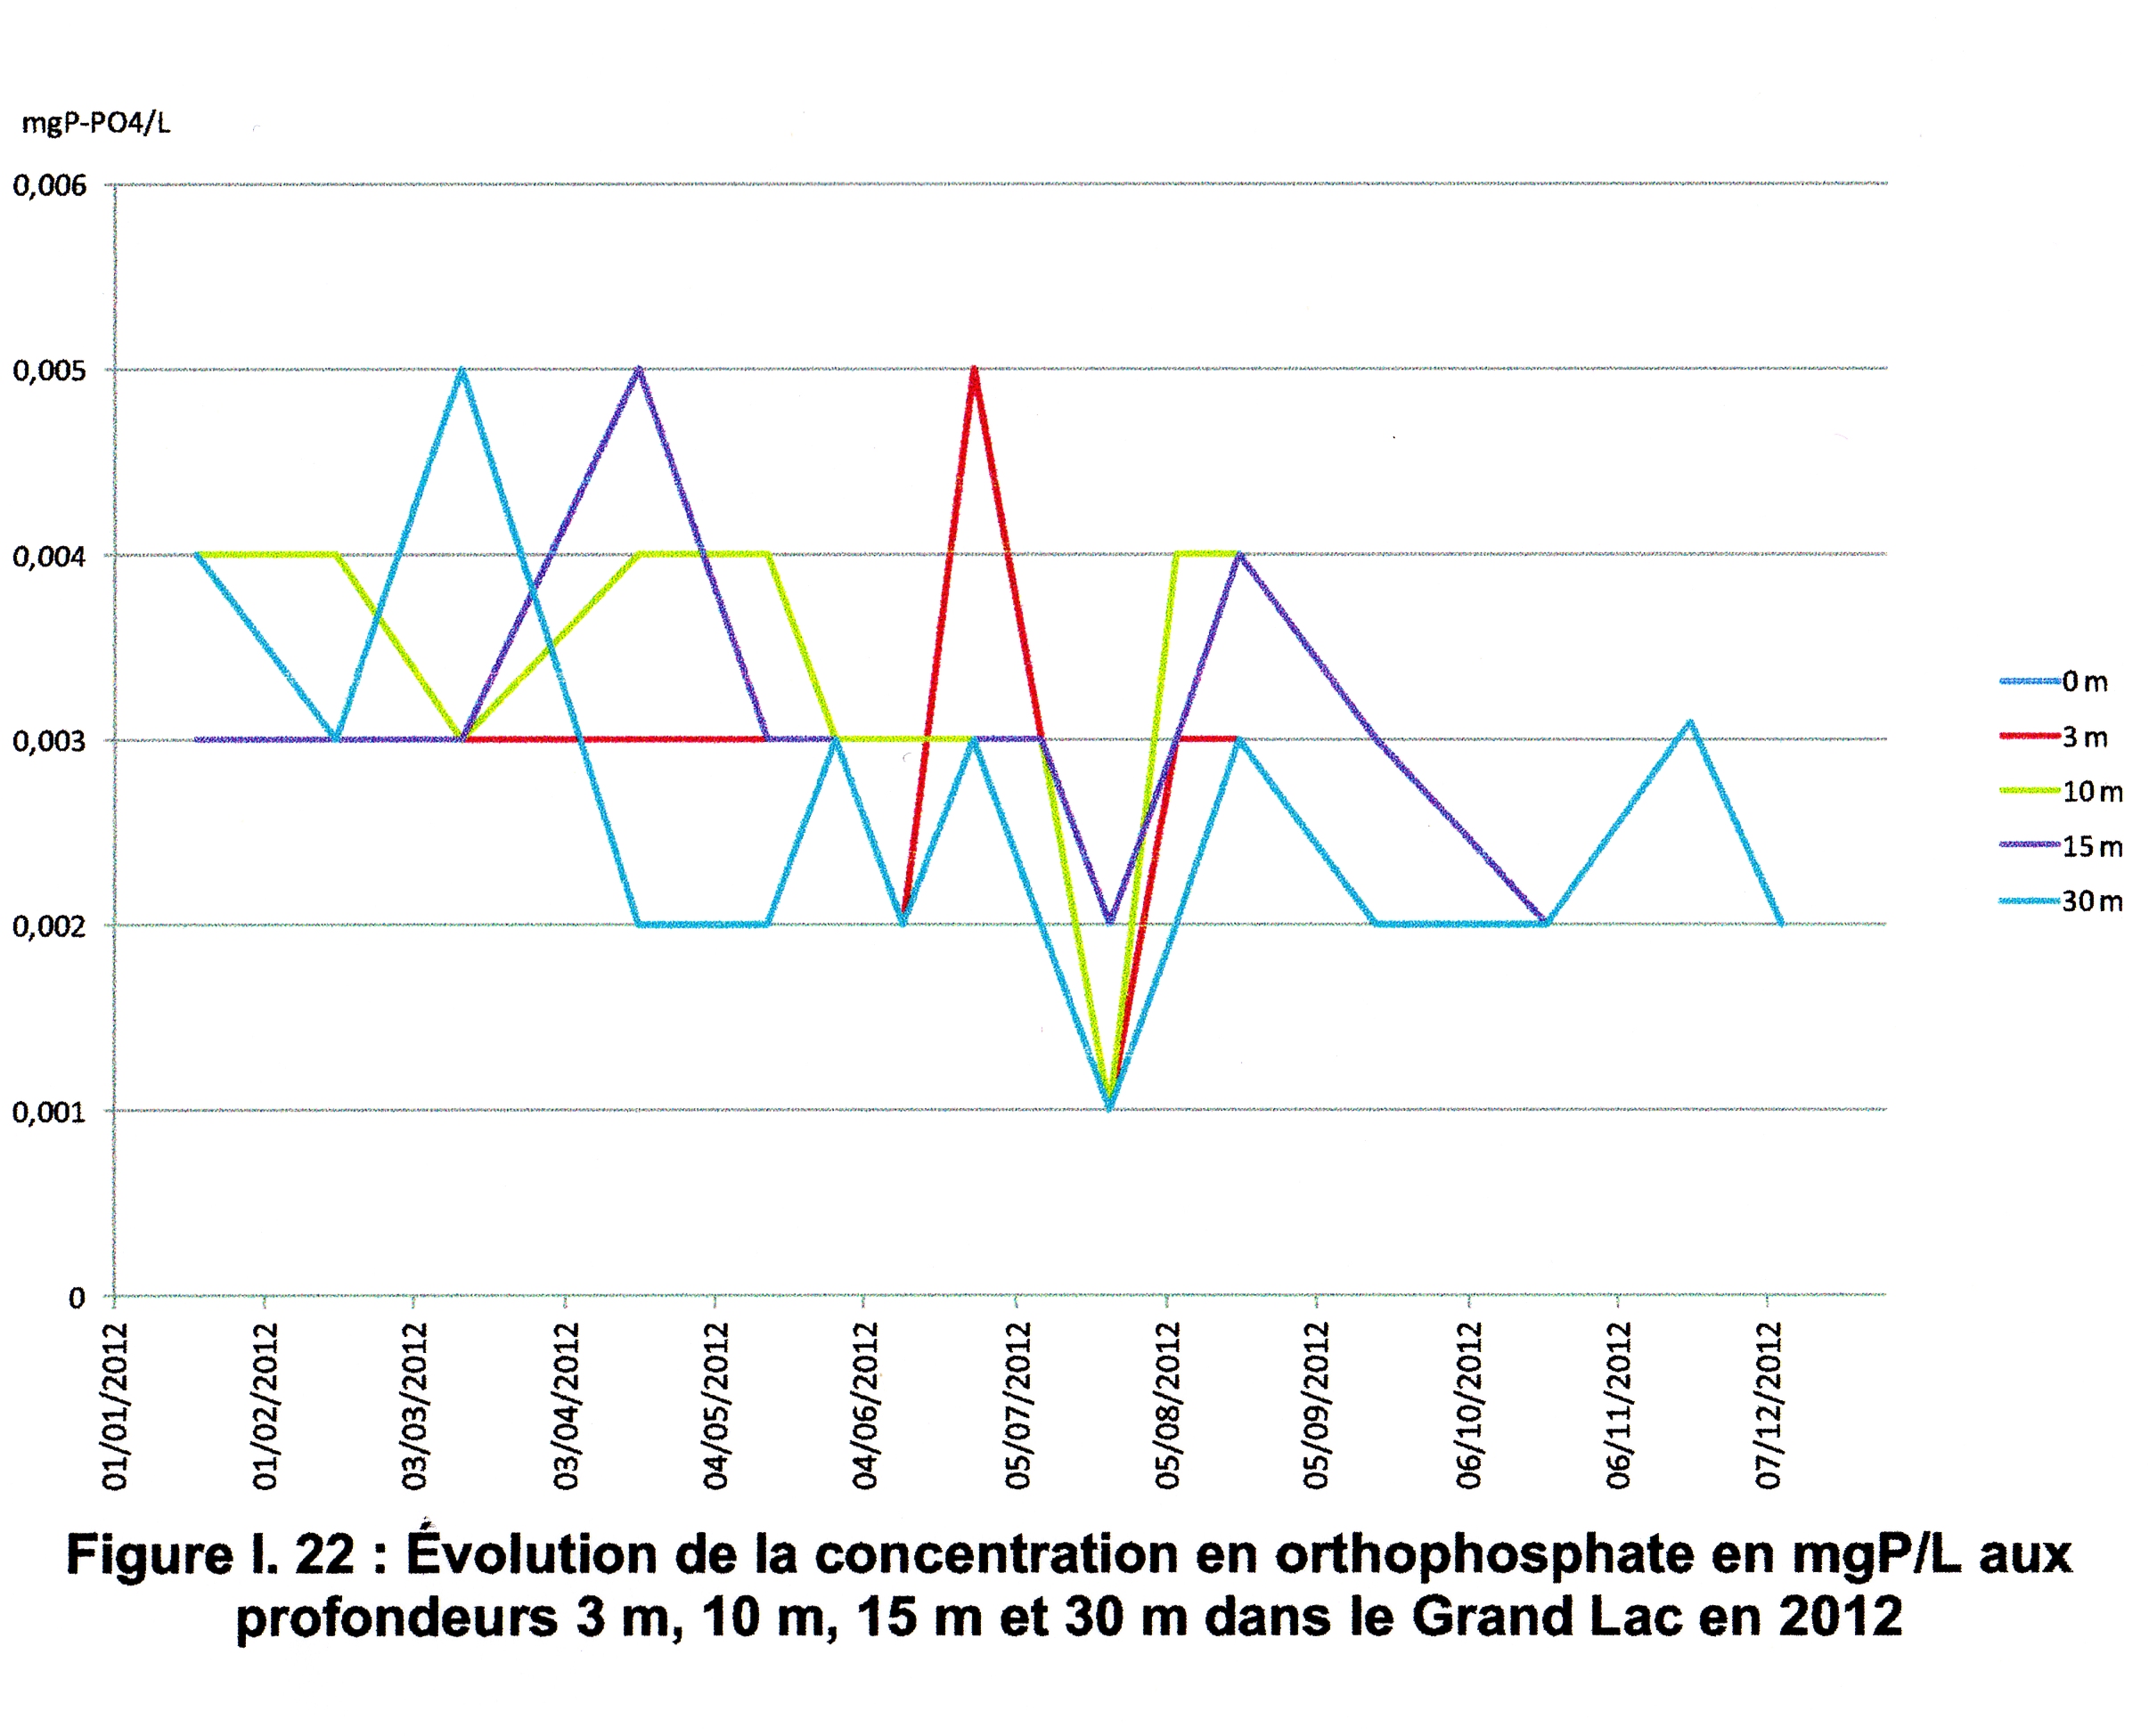
Phosphate
Relationship between phosphate and nitrogen
Overall conclusion relative to physical chemical properties of Lake Annecy
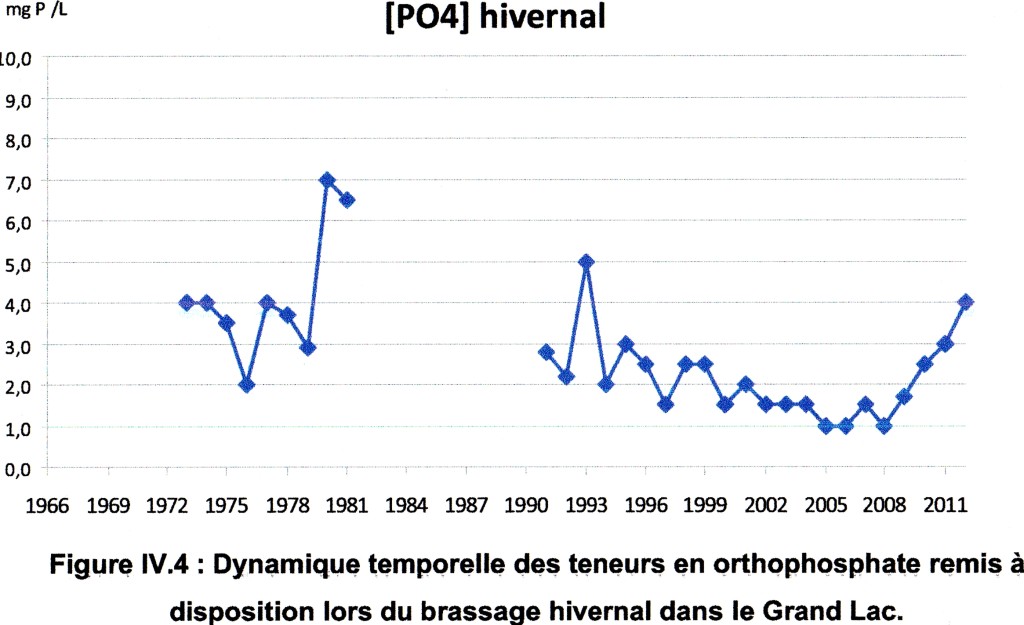
As regards to phosphate, the key element which is a limiting factor for the growth of phytoplankton, we note low levels (in line with the range observed over the last 10 years). Lake Annecy is characterized, as already been reported several times in limnological surveys, by a phosphate content below the threshold of 10 μg Per Litre in the upper pelagic zone. If we analyse the historical data available (figure IV.4) concerning phosphate content at the time of the winter brassage this threshold of 10 μg Per Litre is never breached between 1973 and 2012.
Overall growth of phytoplankton of Lake Annecy
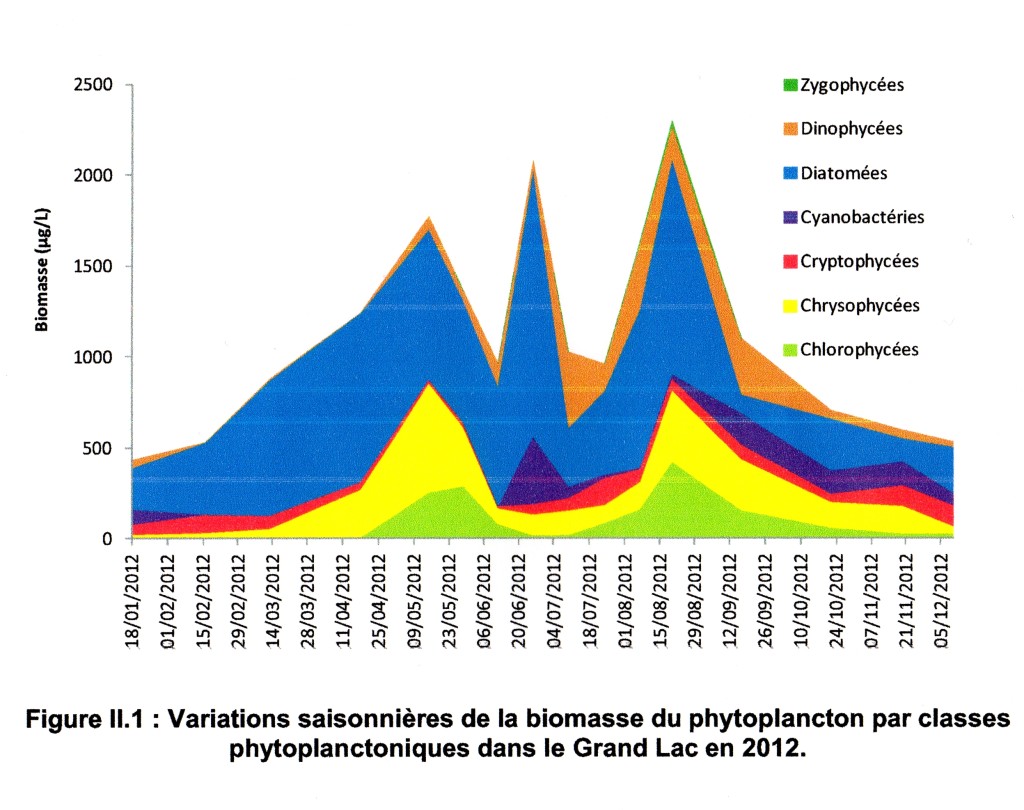
For the Big Lake, the seasonal dynamics can be summarized this way:
- A winter phase (January 18 to February 16) largely dominated by pinnate diatoms and to a lesser extent centric diatoms.
- A spring phase (March 13-May 16), which sees the phytoplankton biomass increase until 15 May. Diatoms and Chrysophyceae represent most of the biomass. We also note a non-negligible biomass of several species of Chlorophyceae (Scenedesmus spp.) usually indicative of more eutrophic conditions. Their presence can also be linked to favorable thermal conditions.
- At the end of May, the grazing pressure of zooplankton (Daphnia in particular) contributes to the decline in phytoplankton biomass.
- A summer (August 16-June 20), dominated by diatoms and Chrysophyceae, and a relatively large biomass of Chlorophyceae compared to previous years.
- An autumn and winter phase (September 17 to December 10) marked by a decrease in biomass and the dominant presence of diatoms and Chrysophytes.
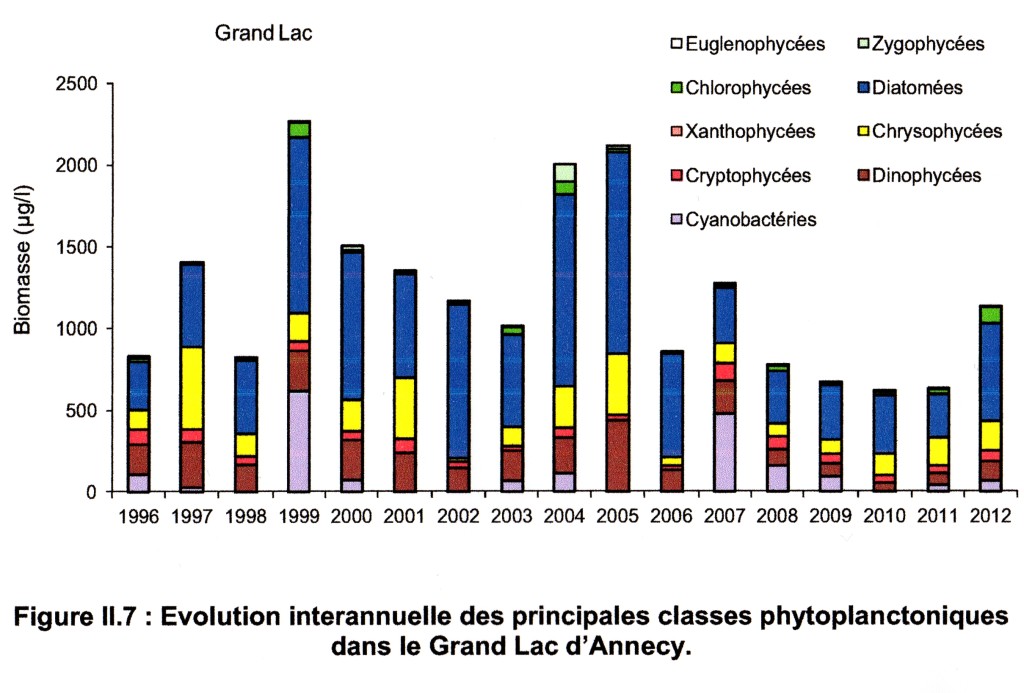
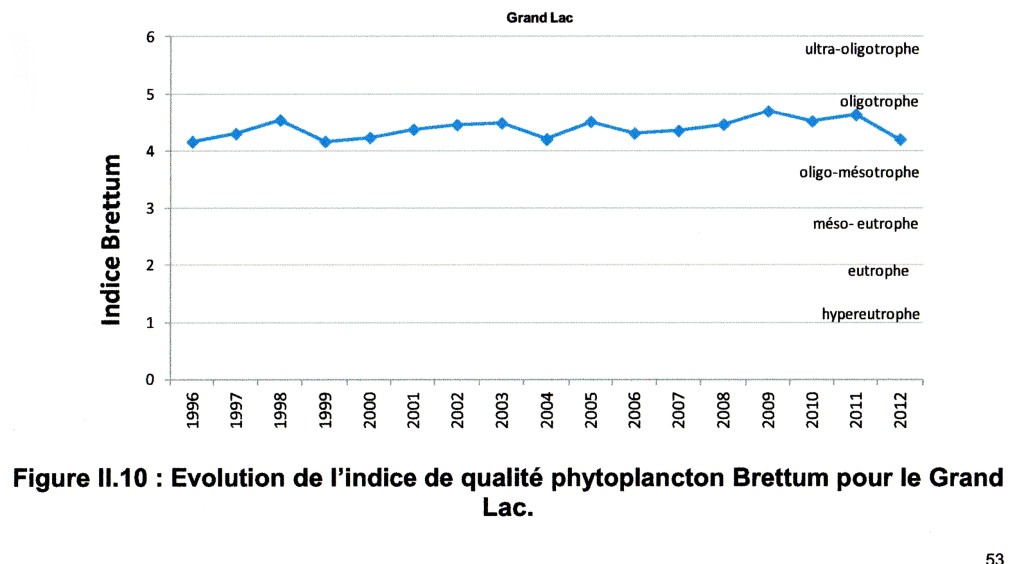
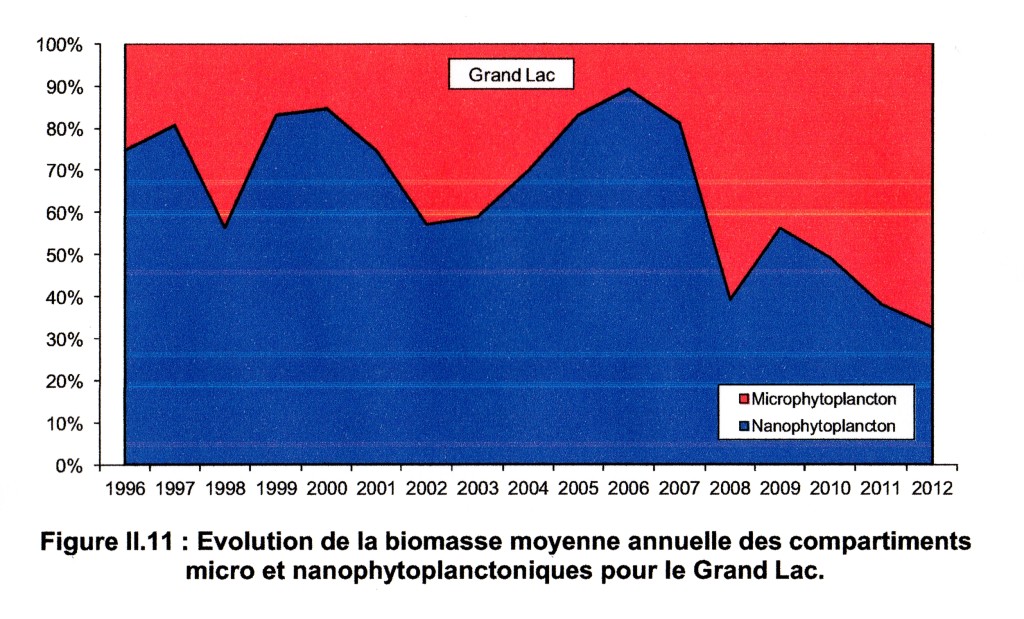
The inter-annual dynamics can be summarized in this way: the year 2012 has a higher biomass than previous years (2008-2011). The proportion of Chlorophyceae is also more significant; this is generally considered to be a group indicative of more eutrophic conditions. The presence of this group explains the drop in value of the Brettum index in 2012 compared to the three previous years. Their growth may simply be attributable to random interannual variability (similar to one-off variations in growth in cyanobacteria in some previous yearss). Indeed, as with other groups typically associated with oligotrophic conditions, during these years cyanobacteria or Chlorophyceae have probably benefitted from favourable environmental conditions, especially thermal. Some changes seem to fit a clear trend, for example the increasing proportion of microphytoplankton (this year, for example a significant increase in Fragilaria crotonensis which is considered to be thermophilic). Again, changes in the intensity and duration of the thermal stratification of the lake could be the cause. Structural changes in size (micro versus nano phytoplankton) are taking place concurrently with the lowering of the thermocline (the result of a more pronounced and stable stratification). The apparent links between cause and effect for this kind of data in the medium term should however, be handled with caution, as many other factors are at work influencing the development of phytoplankton.
Evolution of overall indicator of quality of phytoplankton of the years
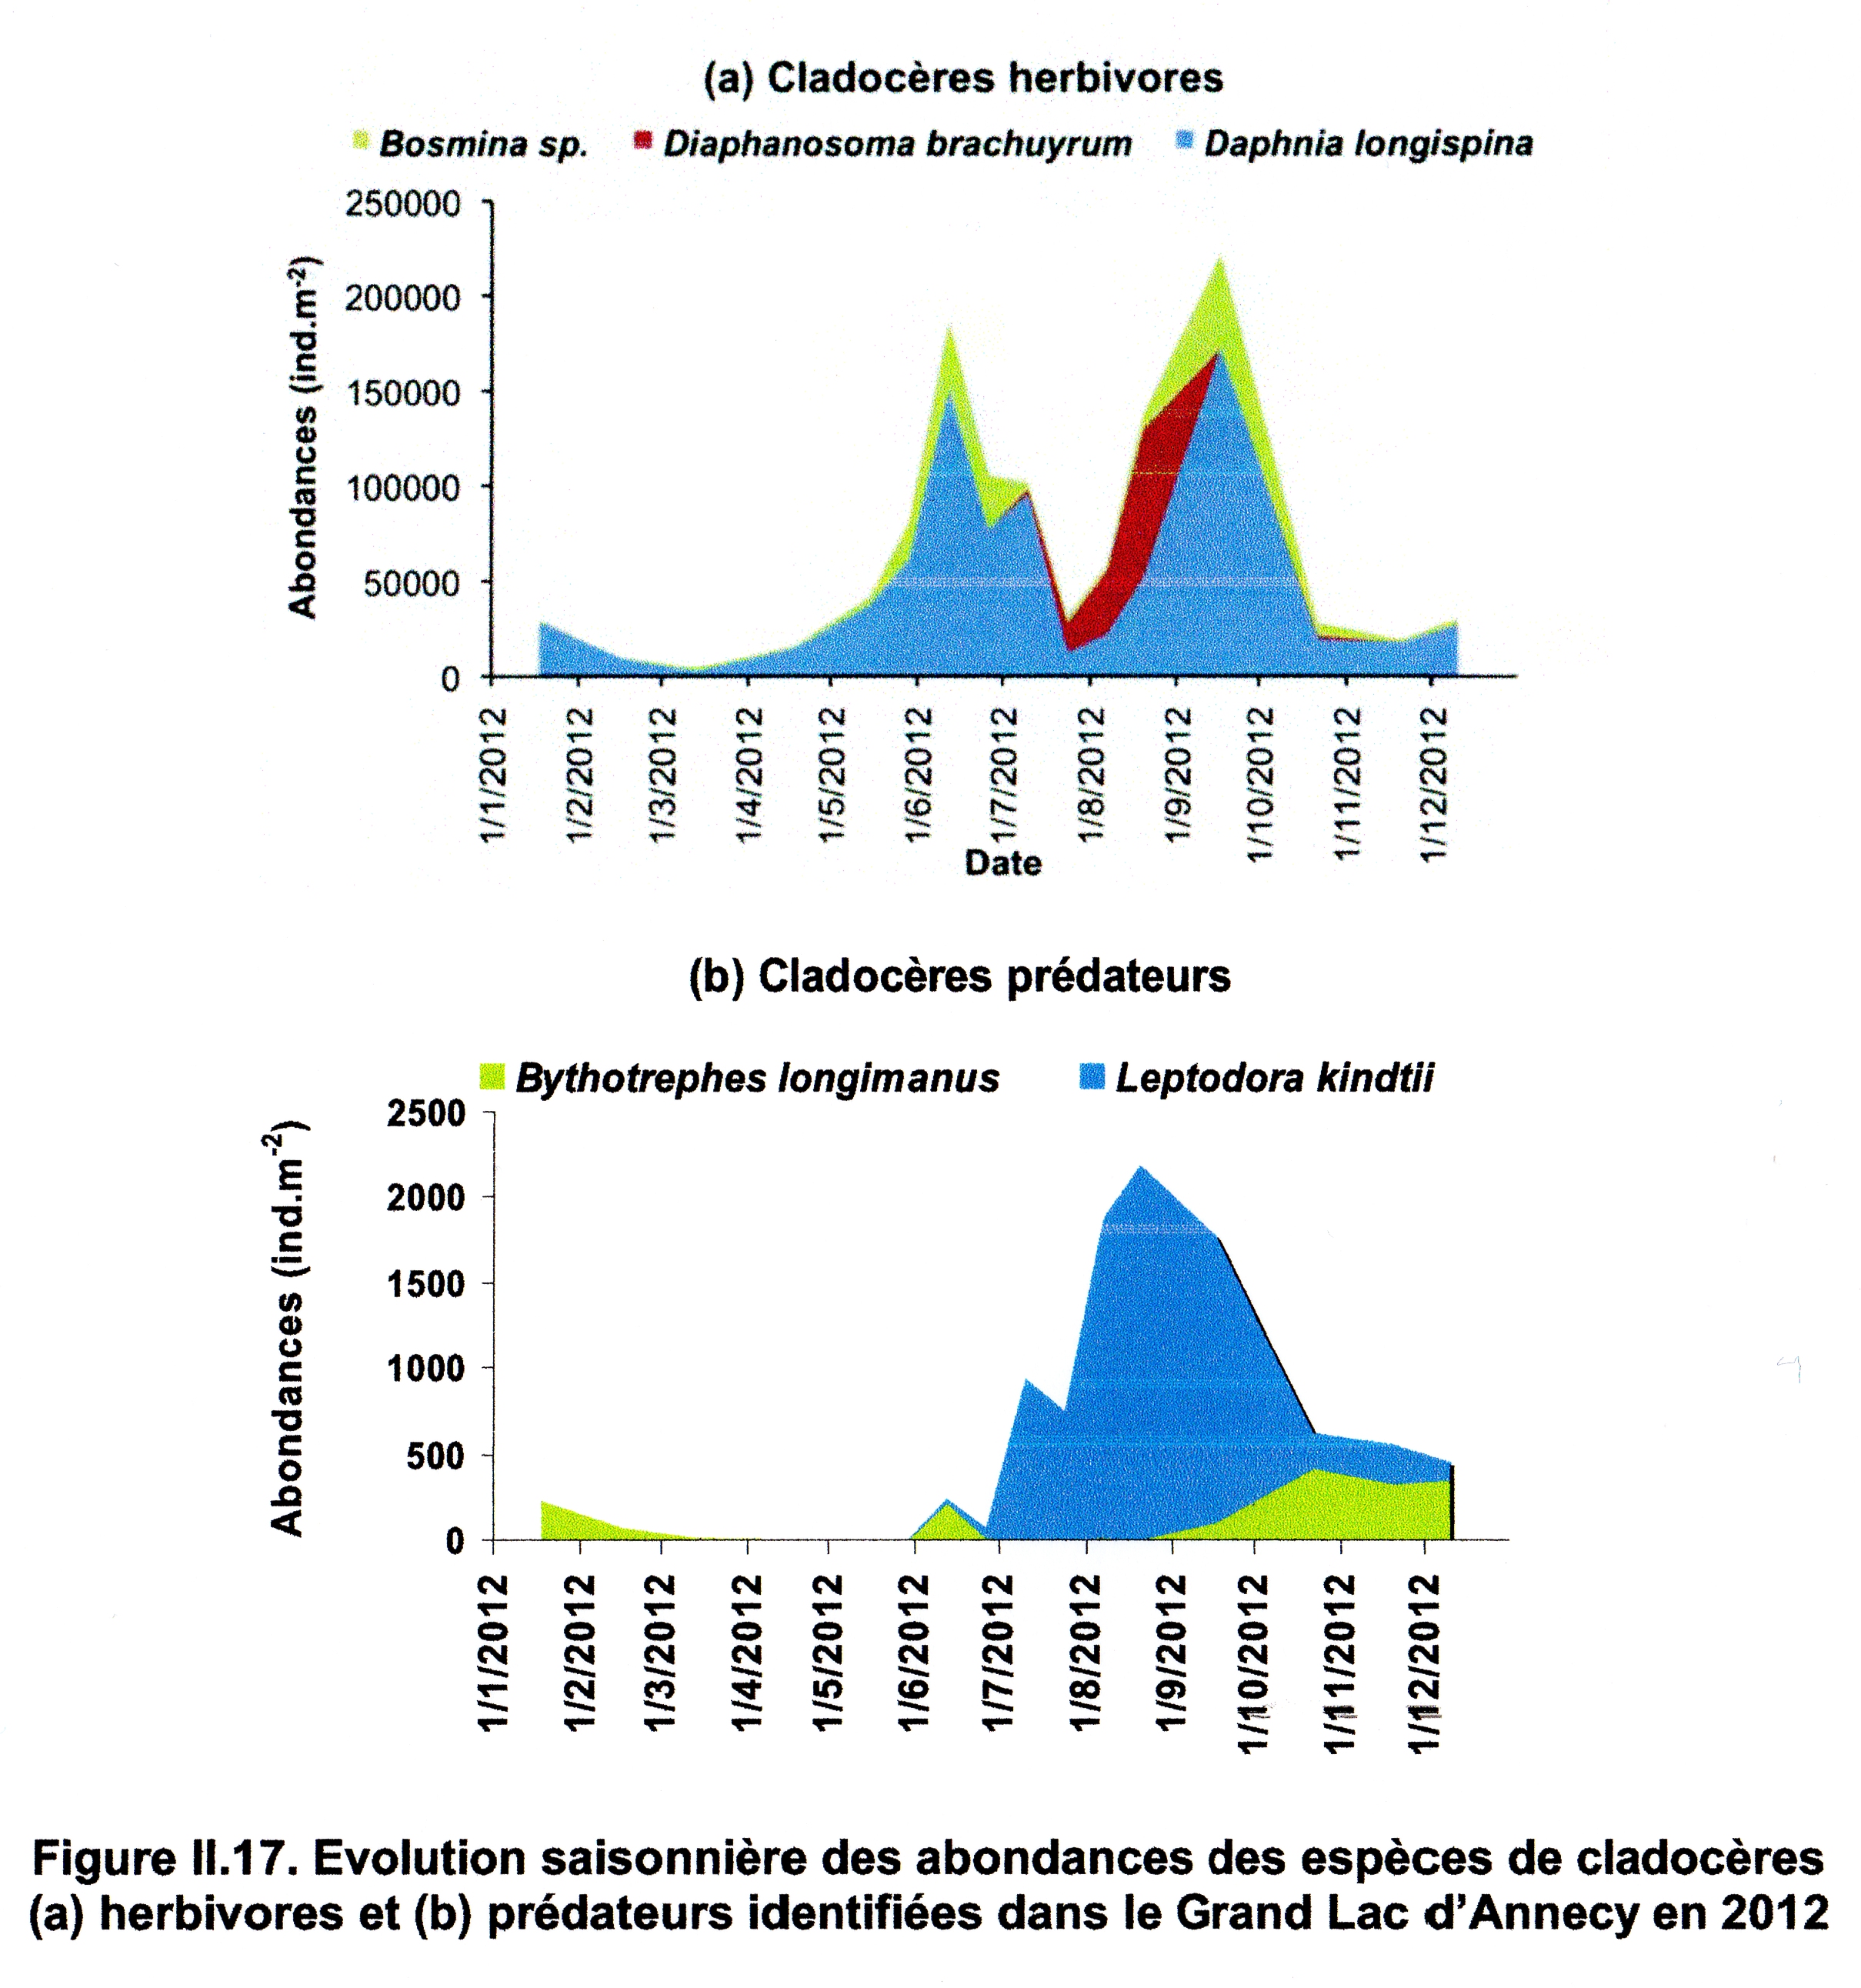
Long term evolution of major types of zooplankton
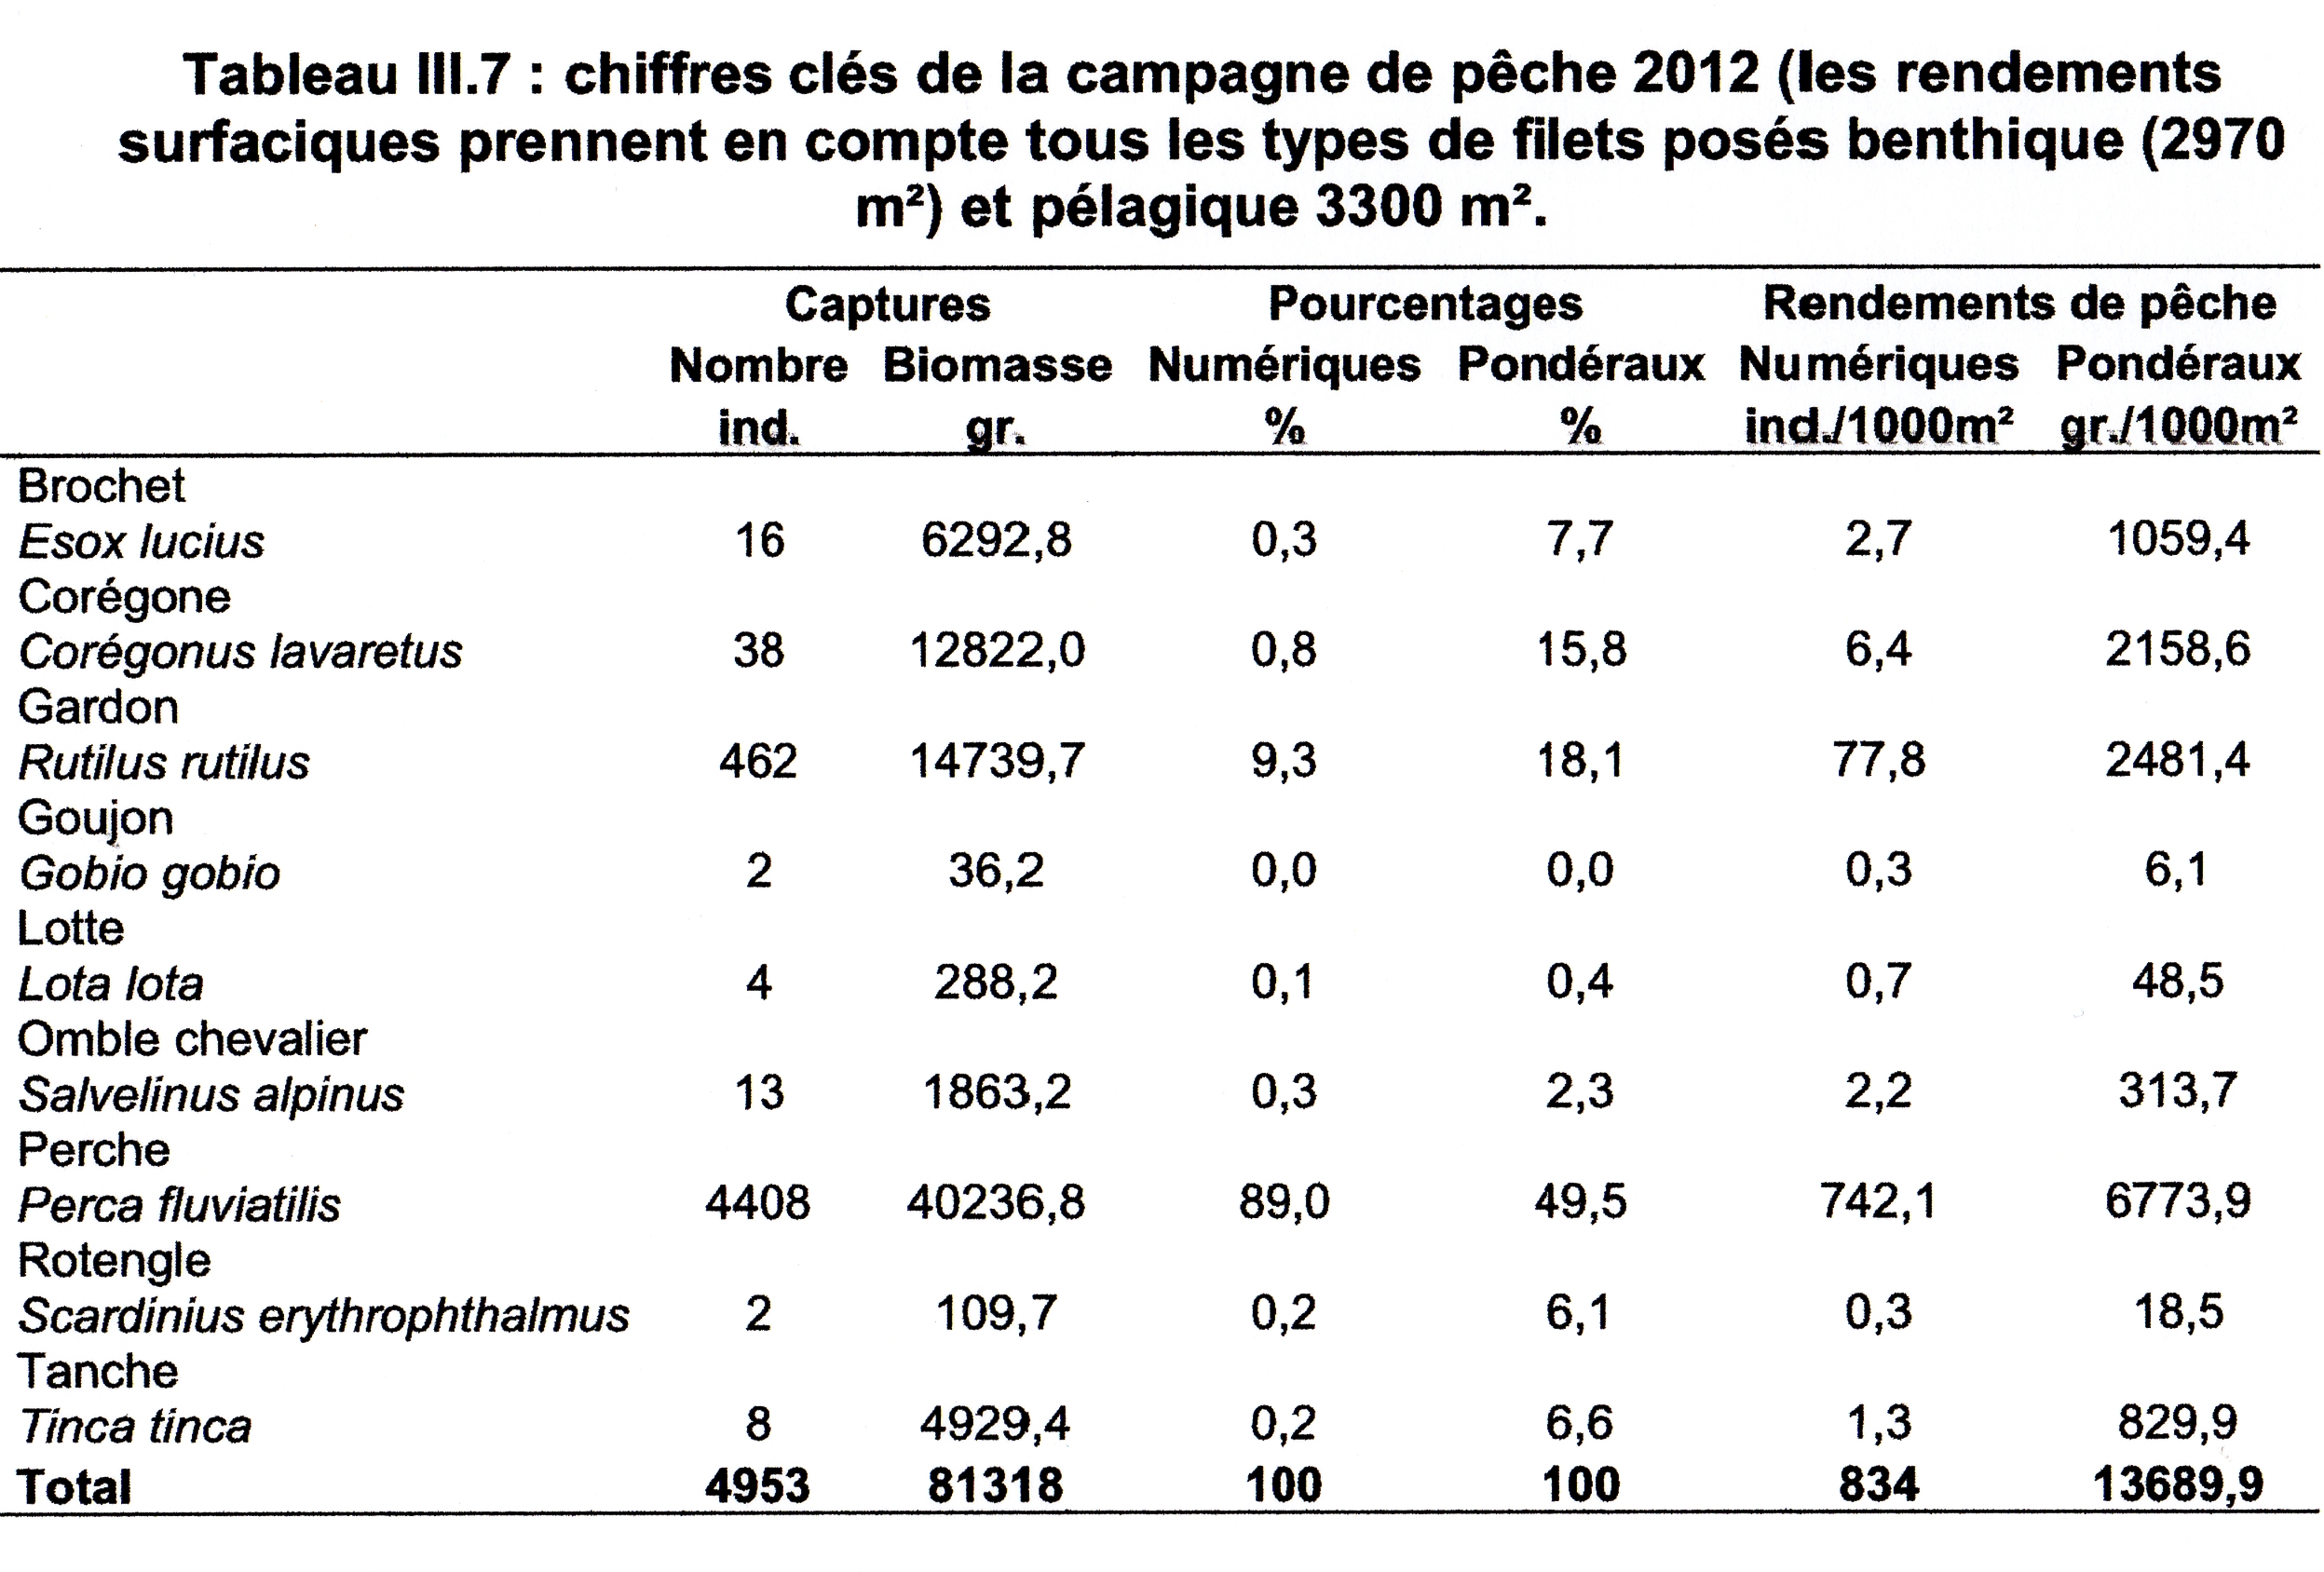
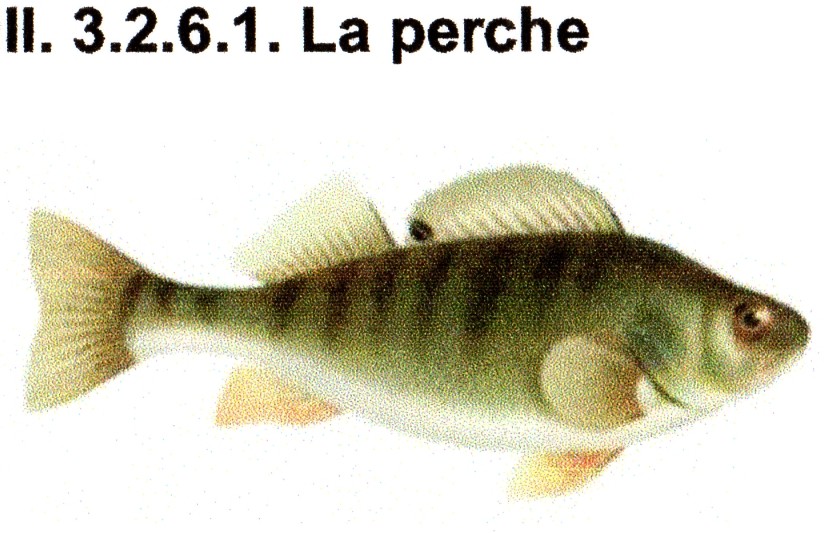
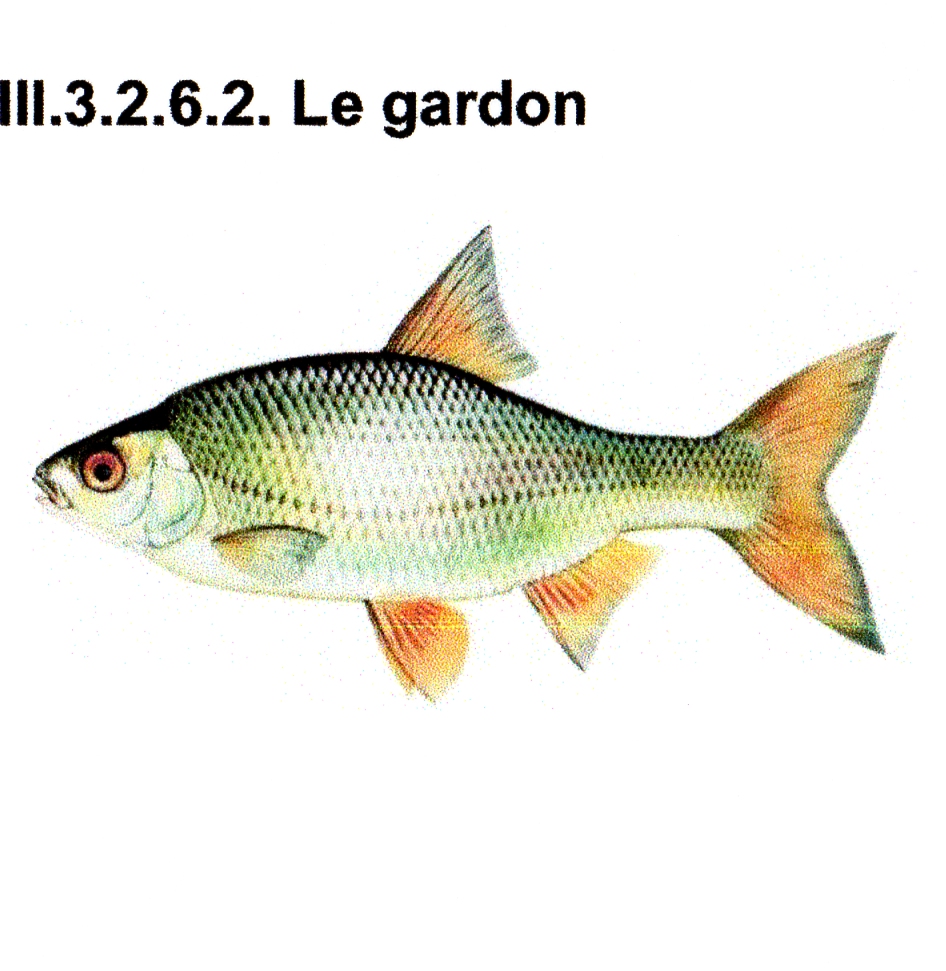
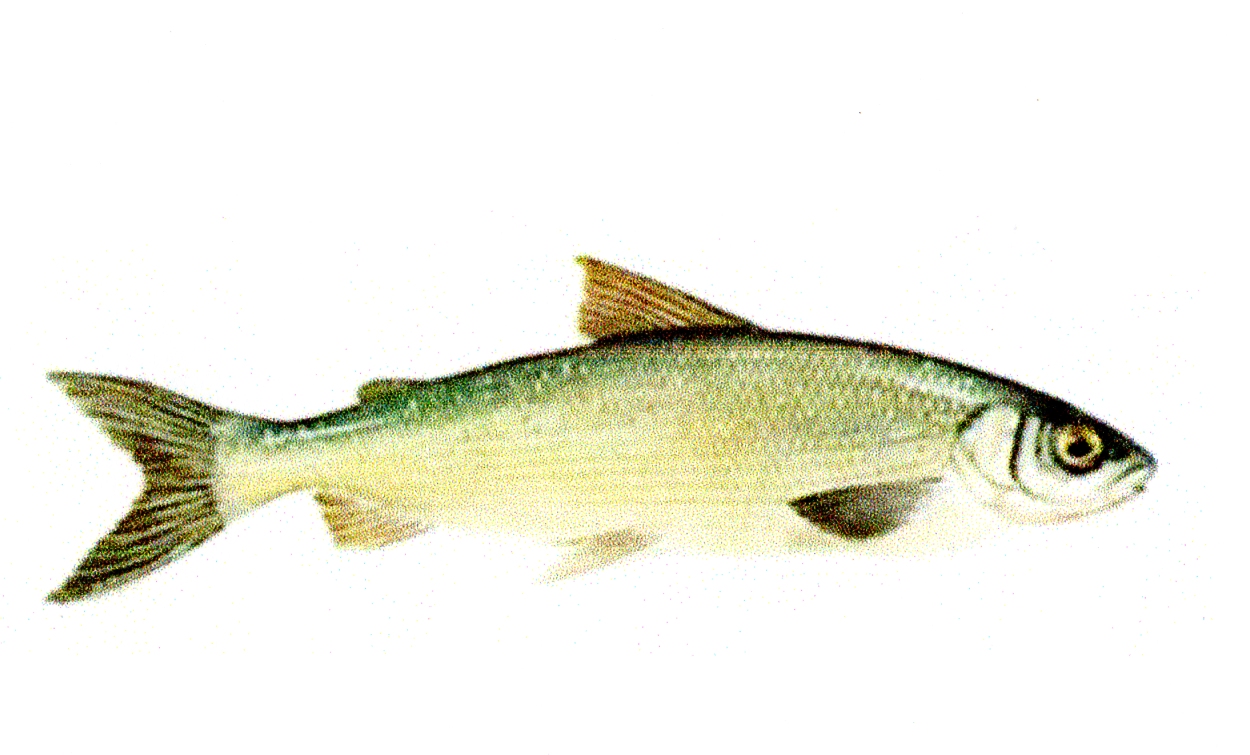
Census of the fish population